This document is basically a write-up and introduction to a small experiment I wrote to test the viability of quadtrees for triangle meshes. If you want to skip straight to the graphs and experiment: click here.
Given a triangle mesh defined by vertices, we can (on average), efficiently find the triangle bounding any given point using a quadtree. This techinique is also known as spatial partitioning.
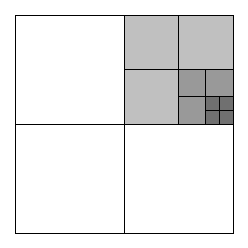
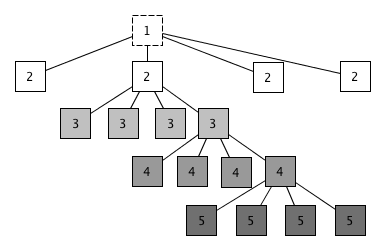
We will first see how to index a mesh using a quadtree. Every node in the quadtree will represent the rectangle \( R \) bounding \( x_0 \leq x \leq x_1 \) and \( y_0 \leq y \leq y_1 \), and will have a depth \( d_n \), starting from 1 (see figure 2). It will have the following operations:
Triangles() return the list of triangles associated with the node.
Add(T) if the given triangle \( T \) is within \( R \), or if the \( R \) is within \( T \), or any of the edges of \( T \) intersects the edges of the \( R \), associate it with the node.
Partition(q, d) if \( |\text{Triangles()}| \gt q \) and \( d_n \lt d \), create four child nodes which partition \( R \) into 4 equally sized regions (see figure 1), add the triangles associated with the current node to each of the four nodes, and then partition those nodes again with the same parameters. This can be implemented in pseudocode like the following:
def partition(self, q, d):
    if self.depth < d and len(self.triangles()) > q:
        self.children = partition_into_nodes(self.r)
        for n in self.children:
            n.add(self.triangles())
            n.partition(q, d)
Contains(p) returns true if \( p \) is inside \( R \).
Query(p) returns the triangle that bounds \( p \). This can be done by recursively searching the child that contains \( p \) until we have reached a leaf node, and then testing each of the triangles associated with that node:
def triangle(self, p):
    if not self.contains(p):
        return
    node = self
    while True:
        if len(node.children) == 0:
            break
        for child in node.children:
            if child.contains(p):
                node = child
                break
    for triangle in node.triangles():
        if triangle.contains(p):
            return triangle
Of particular interest is the highlighted line, which assumes that
the value of the variable node has changed from the
previous iteration, i.e. it is one of the child nodes. Hence the
code handling the partitioning must be robust against rounding errors.[1]
A common question that arises is what happens if the point being queried lies on the edge of a triangle or the edge of a node which triangle/node should be tested? In that case either triangle can be returned, and we cannot assume (nor should we) that the algorithm makes any guarantees about which is returned.
The pseudocode for using our algorithm to partition/index-into the mesh is straightforward (but in 'real world' implementations we can just set the internal list of triangles to the triangles in the mesh, as the topmost node must contain all triangles in the mesh).
node = Node(bounding_box(mesh))
for triangle in mesh.triangles:
    node.add(triangle)
node.partition(q, d)
I have written a reference implementation in Go that can be found
on Github. Intuitively
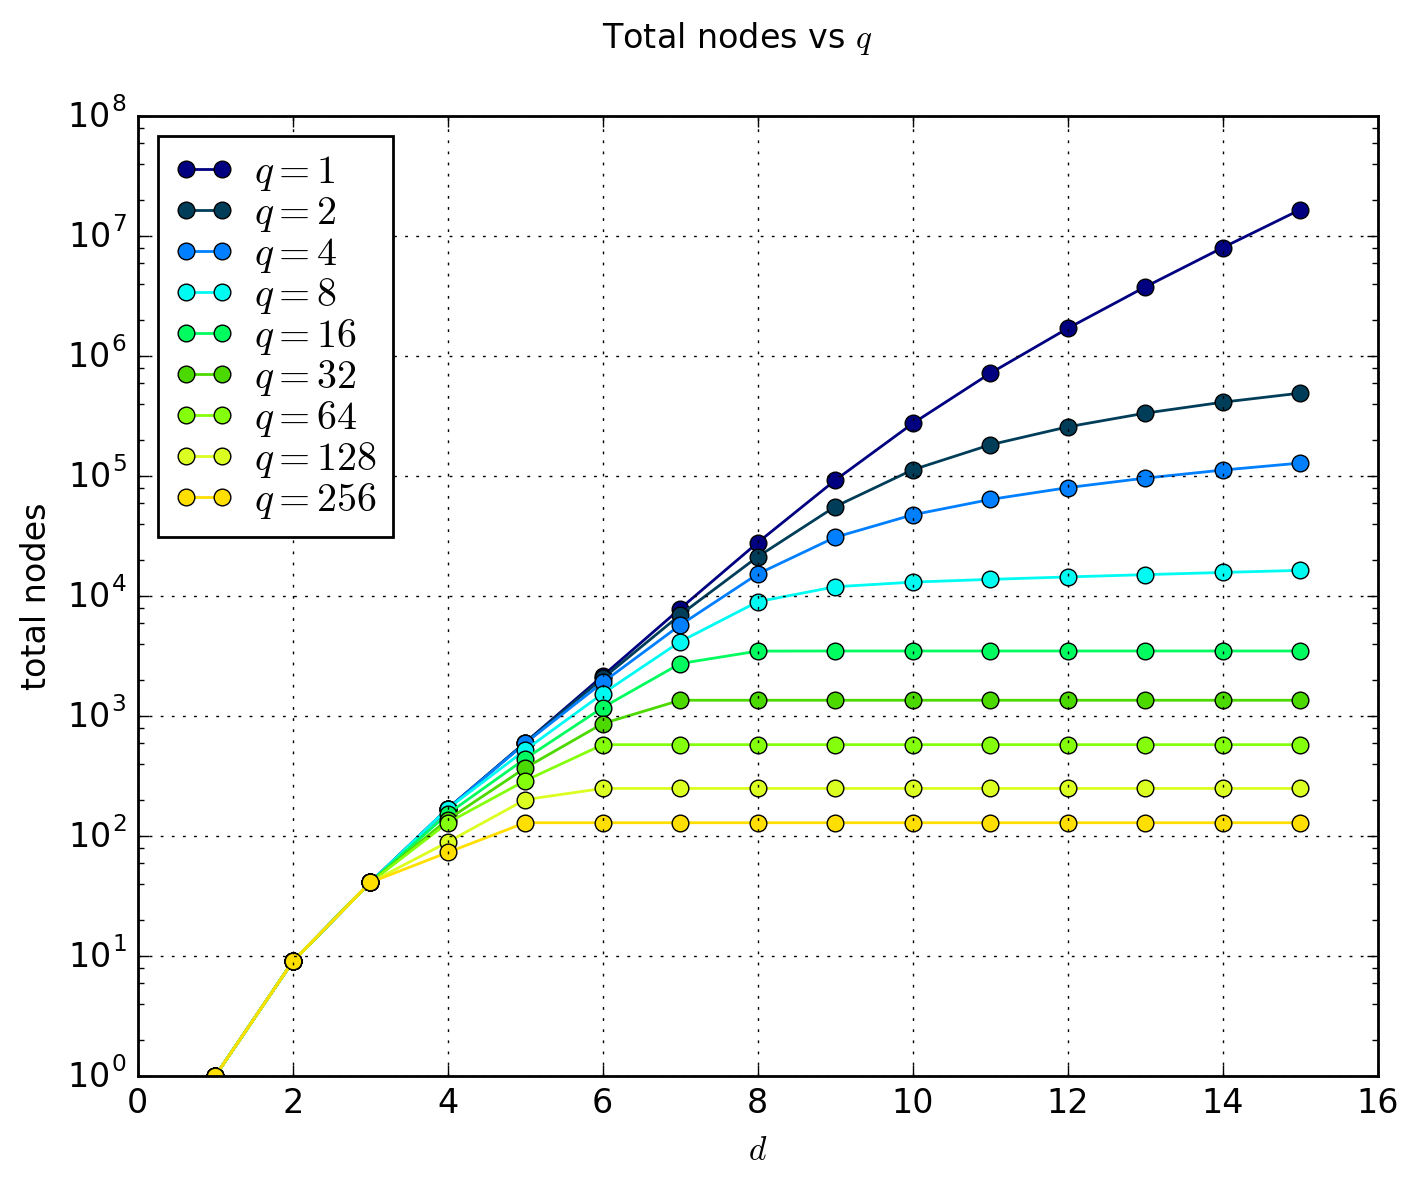
we can see that the space requirements for such a data structure depends heavily
on the \( q \) and \( d \) factors involved. For instance a tree with a high
\( d \) will tend to branch out more if \( q \) is small enough. We also find
that intuition about the effect of \( d \) and \( q \) on the number of nodes
required to partition the mesh is correct, as the figure shows (take note that
the y-axis is logarithmic):
Another factor to consider is the time required to query the triangle bounding one point. We can see that it is in the best case, \( O(q) \) but \( O(n) \) in the worse case - consider a mesh where all of the \( n \) triangles share one common 'origin' vertex. In that case it is possible to end up with one node that will contain all of the triangles.
Therefore our quadtree approach is very input sensitive, and performs slightly
better for different types of meshes. Below is the graph of how the algorithm
performs when it comes to querying the quadtree, with the y-axis representing
how many triangles (in total, over all of the queries) are scanned to return the
result of 2000 random query points.
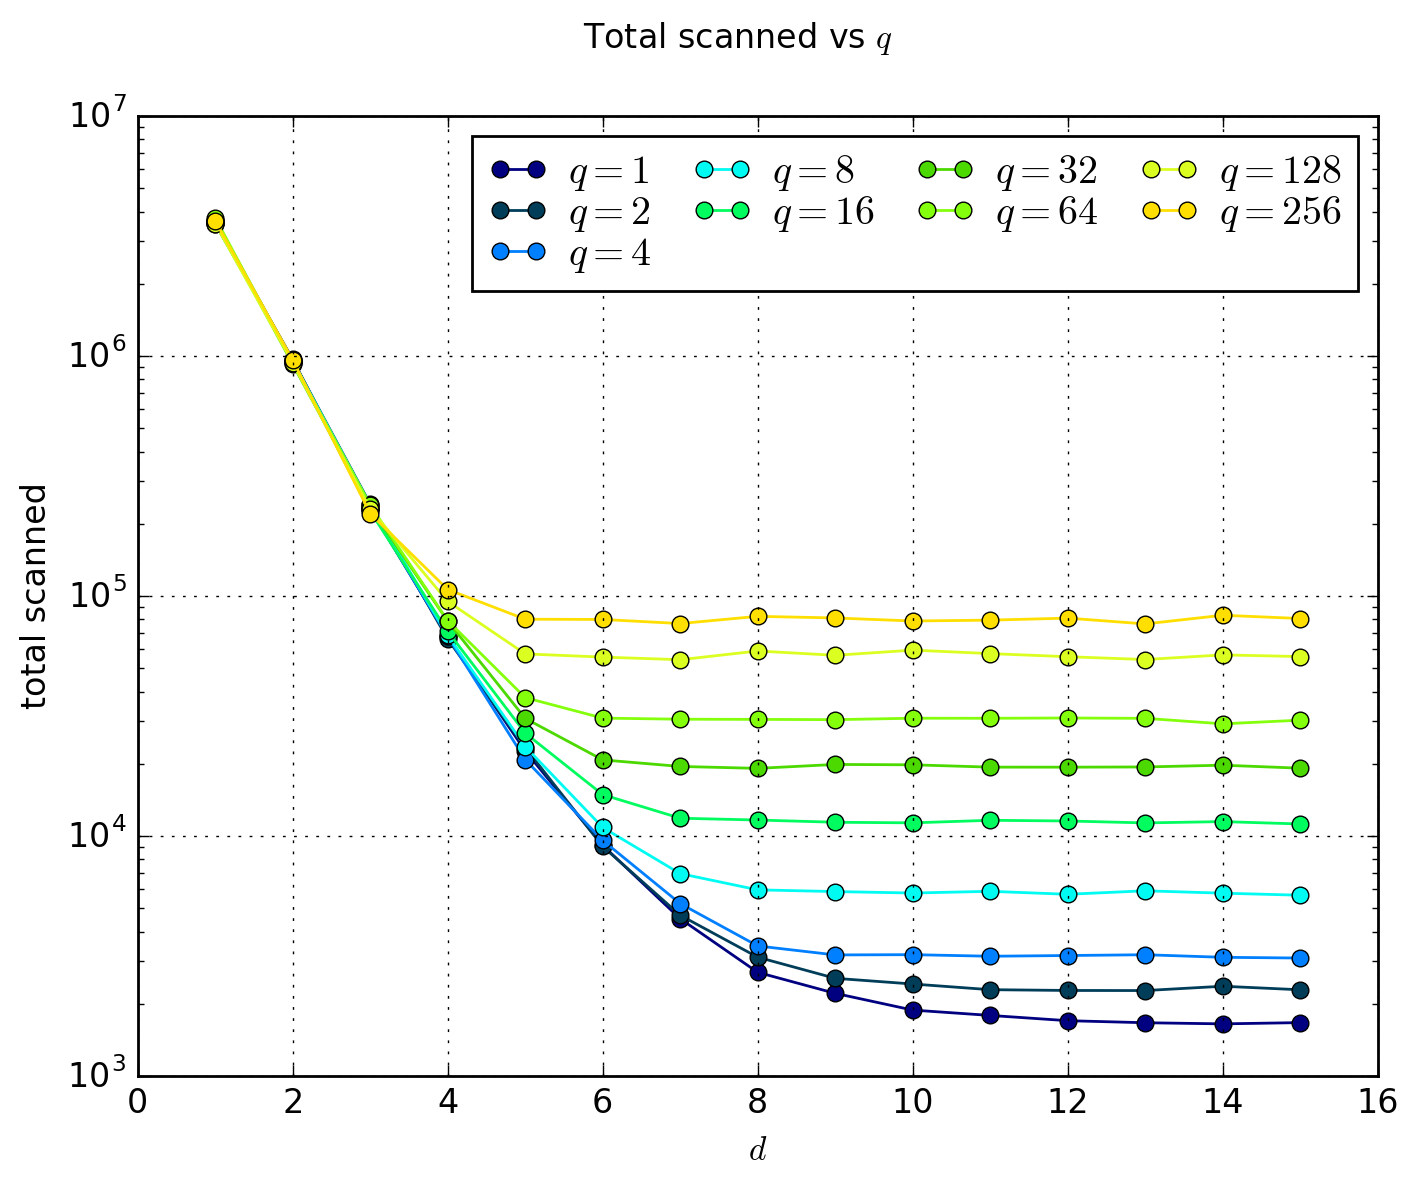
As we can see from the graphs, a depth of around 8 is optimal (for our input pattern) as most values for \( q \) start to converge, and the number of nodes used for most values of \( q \) has already 'saturated'. If anything, the lesson learnt here is to never use \( q = 1 \) unless you know beforehand that the mesh is able to be nicely partitioned.
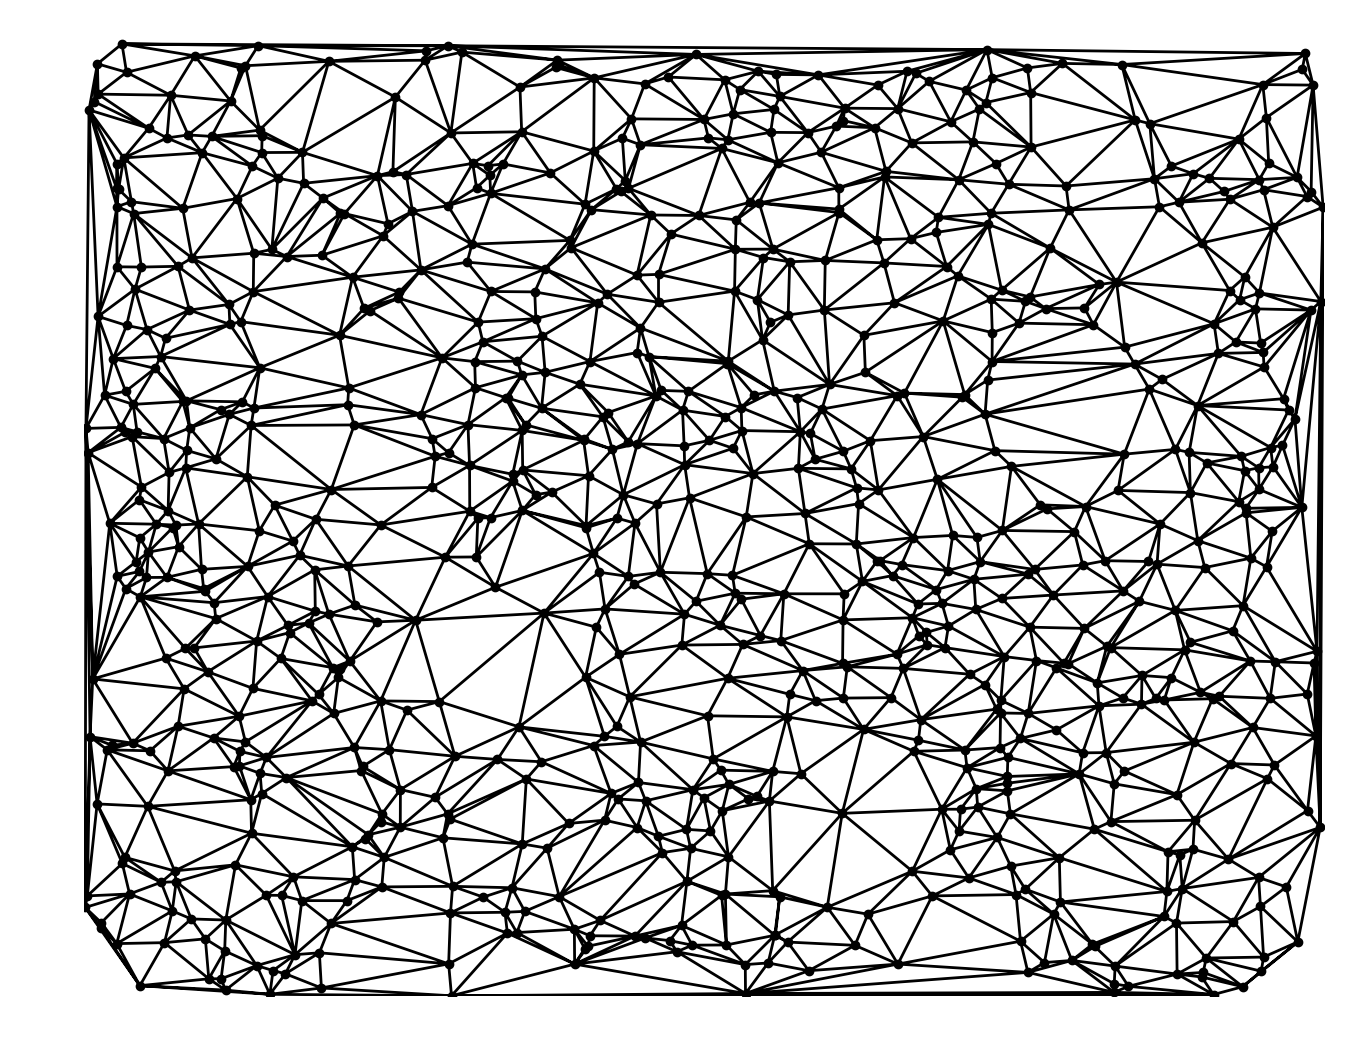
The mesh was generated by computing the Delaunay Triangulation of 2000 random points sampled from the normal distribution \( x,y \sim N(0, 2.5^2) \). For the random points used to test the quadtree, a uniform distribution over the range of the bounding box of the mesh, \( x \sim U[x_{\min}, x_{\max}] \) and \( y \sim U[y_{\min}, y_{\max}] \) was used.
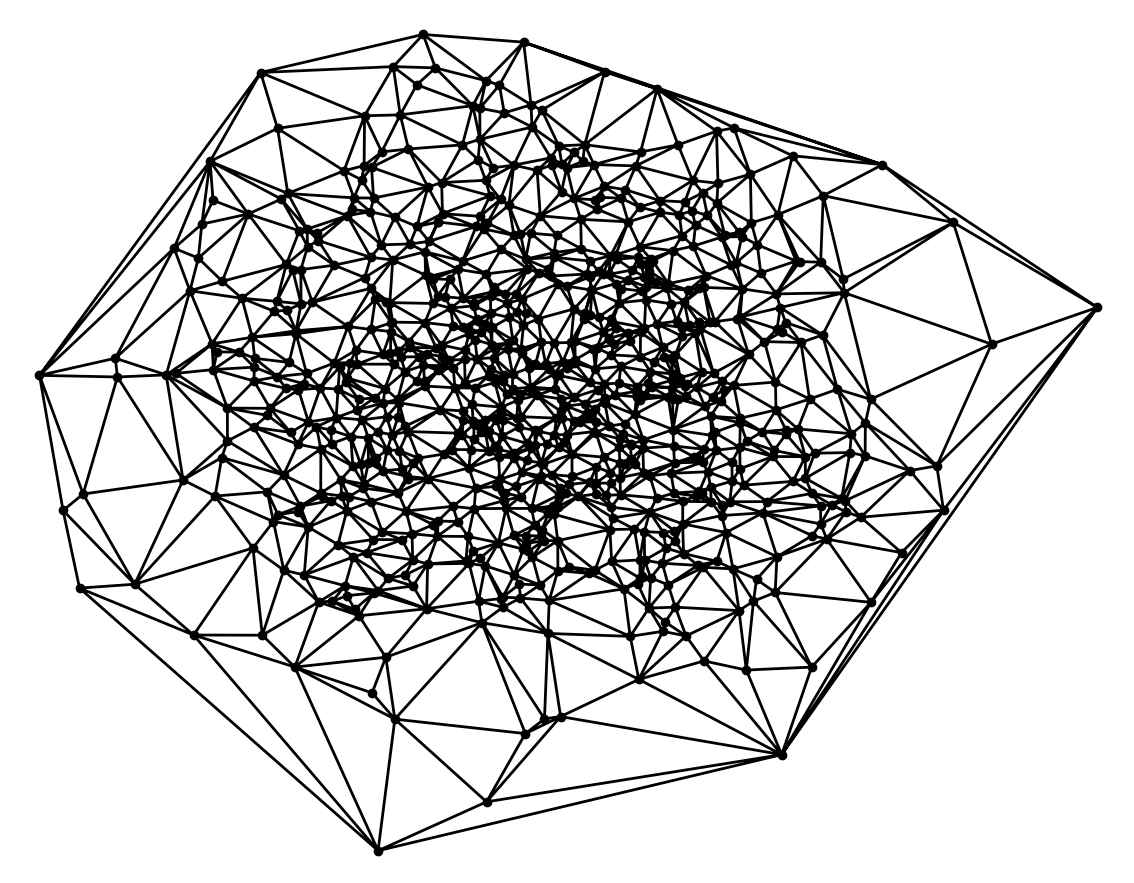
The normal distribution was chosen to obtain a mesh with a lot of vertices in the middle to explore the space requirements when there are lot of triangles in one part of the mesh. I also found it to resemble some natural structures, for instance flowers: most tend to have a lot of detail in one part of the mesh. In the future Poisson Disc Sampling would be a nice thing to look into[2][3].
The tests can be repeated (with probably minor modifications of the code) for different configurations of distributions, but I think the results for the number of triangles scanned will largely have the same distribution/pattern, if not of the same magnitude.